Download تحميل

Reports Reading the Numbers: Understanding What Your Data Is Telling You

The reports module gives you visibility into everything that has happened in your inventory — what was consumed, what was wasted, what was transferred, and how theoretical usage compares to actual usage. Use these reports together for a complete picture of your operation.

التقارير قراءة الأرقام: فهم ما تقوله بياناتك

تمنحك وحدة التقارير رؤية شاملة لكل ما حدث في مخزونك — ما تم استهلاكه، وما تم إهداره، وما تم تحويله، وكيف تقارن الكميات النظرية بالاستخدام الفعلي. استخدم هذه التقارير معاً للحصول على صورة كاملة عن عملياتك.

Pro tip — Using the reports together: نصيحة احترافية — استخدام التقارير معاً: Start with the Consumption Report for daily cost monitoring. Use the Waste Report to track logged losses. Run the Stock Transfer Report to verify inter-branch movements. Then reconcile everything with the Inventory Report after each physical stock count to get your true variance and food cost percentage. ابدأ بتقرير الاستهلاك لمراقبة التكاليف اليومية. استخدم تقرير الهدر لتتبع الخسائر المسجَّلة. شغِّل تقرير تحويل المخزون للتحقق من حركات ما بين الفروع. ثم قِم بمطابقة كل شيء مع تقرير المخزون بعد كل جرد فعلي للمخزون للحصول على الانحراف الحقيقي ونسبة تكلفة الغذاء.
Recipe Simulator

Before letting recipes run against live sales, use the simulator to validate your setup.

محاكي الوصفات

قبل السماح للوصفات بالعمل على المبيعات الحية، استخدم المحاكي للتحقق من صحة إعدادك.

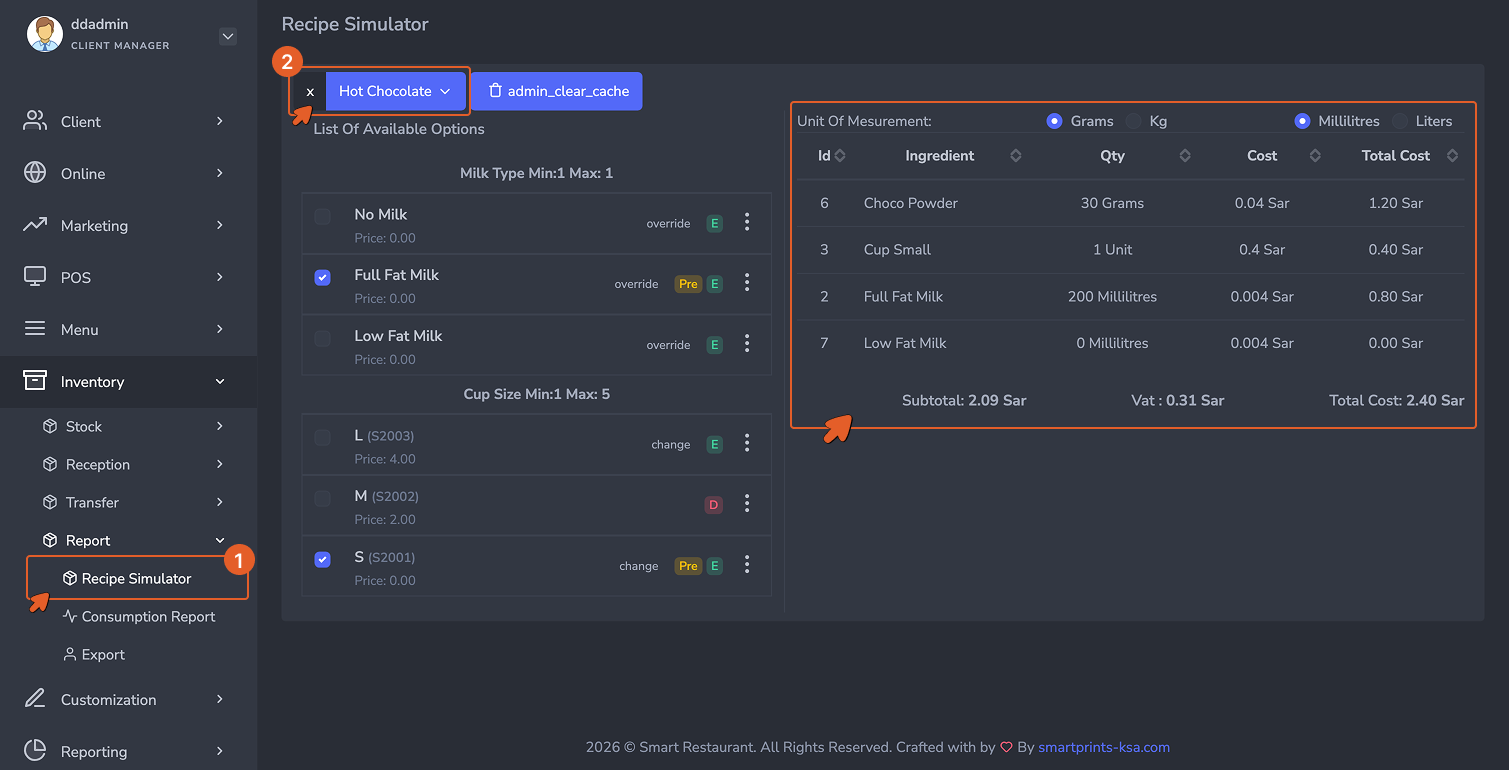
Navigate to Inventory → Report → Recipe Simulator. This is a read-only tool that allows you to preview cost breakdowns, verify margins, and check the impact of ingredient price changes without affecting live data.

انتقل إلى المخزون ← التقارير ← محاكي الوصفات. هذه أداة للقراءة فقط تتيح لك معاينة تفاصيل التكاليف، والتحقق من الهوامش، وفحص تأثير تغييرات أسعار المكونات دون التأثير على البيانات الحية.

Recipe Simulator

The Recipe Simulator shows the details of the cost of any product's recipe including the total cost. Use this before going live to confirm that recipe costs align with your pricing and margin targets.

يُظهر محاكي الوصفات تفاصيل تكلفة وصفة أي منتج بما في ذلك التكلفة الإجمالية. استخدم هذا قبل الانطلاق للتأكد من أن تكاليف الوصفة تتوافق مع أهداف التسعير والهامش.

Key rules and best practices:

القواعد الأساسية وأفضل الممارسات:

  • Products with Options: For customizable items (sizes, protein choices), put common ingredients in the base recipe and manage the variations in the Options tab.
  • Approximate Quantities: Entering "about 20g" instead of the actual measured amount permanently skews inventory.
  • Unit Errors: Entering a quantity in kilograms when the base unit is grams.
  • Outdated Recipes: Always update the system recipe immediately if the kitchen changes a portion size or reformulates a dish.
  • المنتجات ذات الخيارات: للعناصر القابلة للتخصيص (الأحجام، خيارات البروتين)، ضع المكونات المشتركة في الوصفة الأساسية وأدِر الاختلافات في تبويب الخيارات.
  • الكميات التقريبية: إدخال "حوالي 20 جرام" بدلاً من الكمية المقاسة الفعلية يُحرِّف المخزون بشكل دائم.
  • أخطاء الوحدات: إدخال كمية بالكيلوغرام في حين أن الوحدة الأساسية هي الجرام.
  • الوصفات القديمة: قم دائماً بتحديث وصفة النظام فوراً إذا غيَّرت المطبخ حجم الحصة أو أعادت صياغة طبق.

Consumption Report

The Consumption Report gives you a clear picture of how much of each ingredient was theoretically used across your operations during any selected time period — based on your recipes and actual sales.

تقرير الاستهلاك

يمنحك تقرير الاستهلاك صورة واضحة عن الكمية النظرية المستخدمة من كل مكون عبر عملياتك خلال أي فترة زمنية مختارة — بناءً على وصفاتك والمبيعات الفعلية.

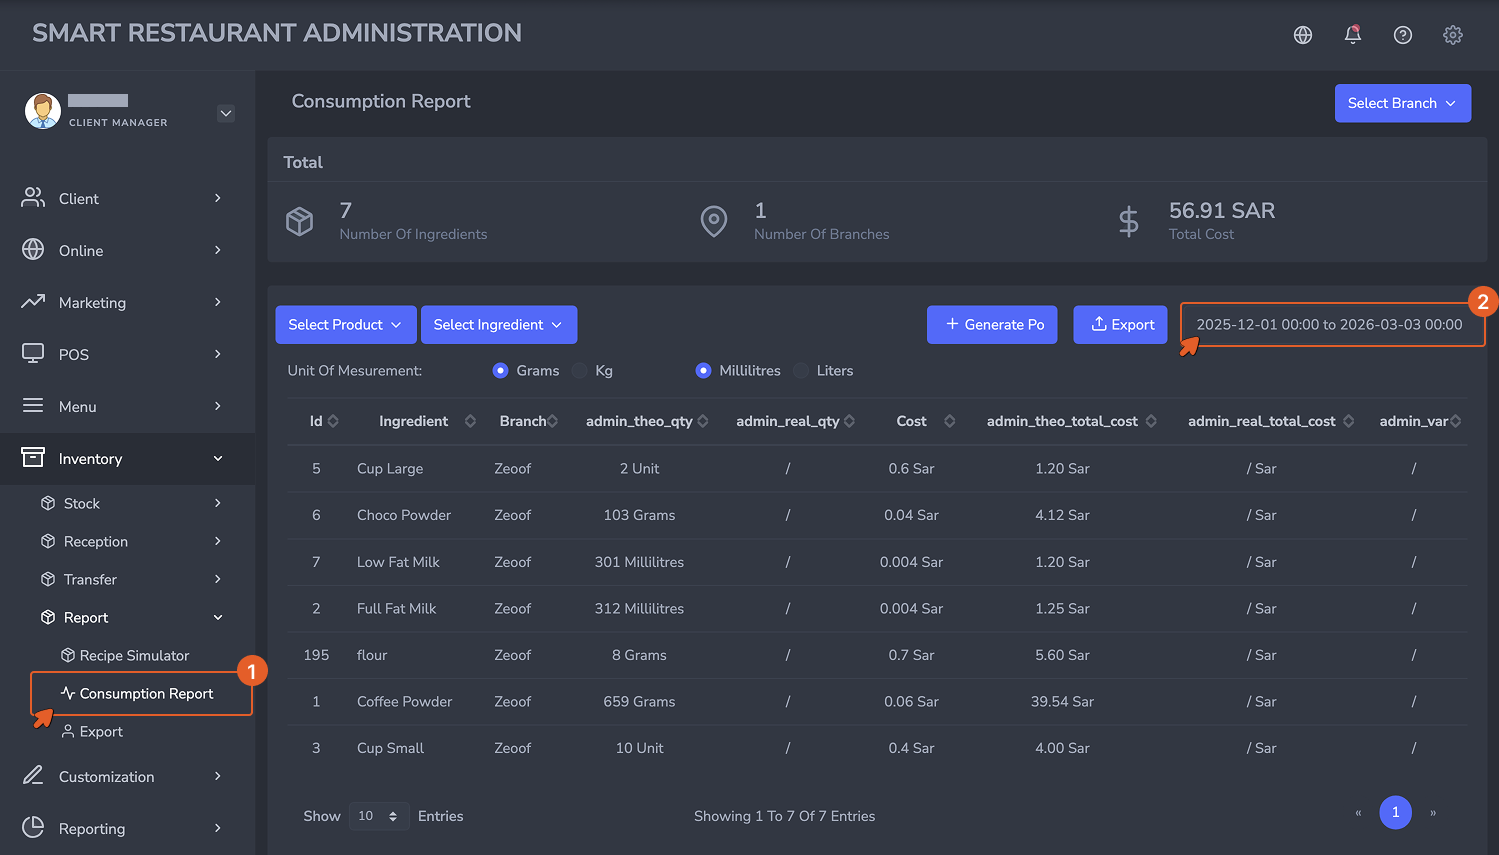
Navigate to Inventory → Report → Export → Consumption Report. Select your desired date range using the date picker, then filter by product or ingredient if needed.

انتقل إلى المخزون ← التقارير ← تصدير ← تقرير الاستهلاك. حدد نطاق التاريخ المطلوب باستخدام منتقي التاريخ، ثم قم بالتصفية حسب المنتج أو المكون إذا لزم.

Consumption Report

The Consumption Report showing ingredient-level consumption data per branch, with theoretical quantities and costs calculated automatically from recipe records.

تقرير الاستهلاك يُظهر بيانات الاستهلاك على مستوى المكونات لكل فرع، مع الكميات والتكاليف النظرية المحسوبة تلقائياً من سجلات الوصفات.

What the columns mean:

معنى الأعمدة:

  • admin_theo_qty: The theoretical quantity consumed based on sales and recipe definitions.
  • Cost: The unit cost of the ingredient at the time of consumption.
  • admin_theo_total_cost: The total theoretical cost for that ingredient over the selected period.
  • admin_real_qty / admin_real_total_cost: The actual quantities and costs recorded (populated when physical stock counts are entered).
  • admin_theo_qty: الكمية النظرية المستهلكة بناءً على المبيعات وتعريفات الوصفات.
  • التكلفة: تكلفة الوحدة للمكون وقت الاستهلاك.
  • admin_theo_total_cost: إجمالي التكلفة النظرية لذلك المكون خلال الفترة المختارة.
  • admin_real_qty / admin_real_total_cost: الكميات والتكاليف الفعلية المسجَّلة (تُملأ عند إدخال جرد المخزون الفعلي).
Use this report regularly to compare theoretical vs. real consumption and spot waste, over-portioning, or stock discrepancies before they impact your margins. استخدم هذا التقرير بانتظام لمقارنة الاستهلاك النظري بالفعلي واكتشاف الهدر أو الإفراط في التقديم أو تناقضات المخزون قبل أن تؤثر على هوامشك.

Inventory Report

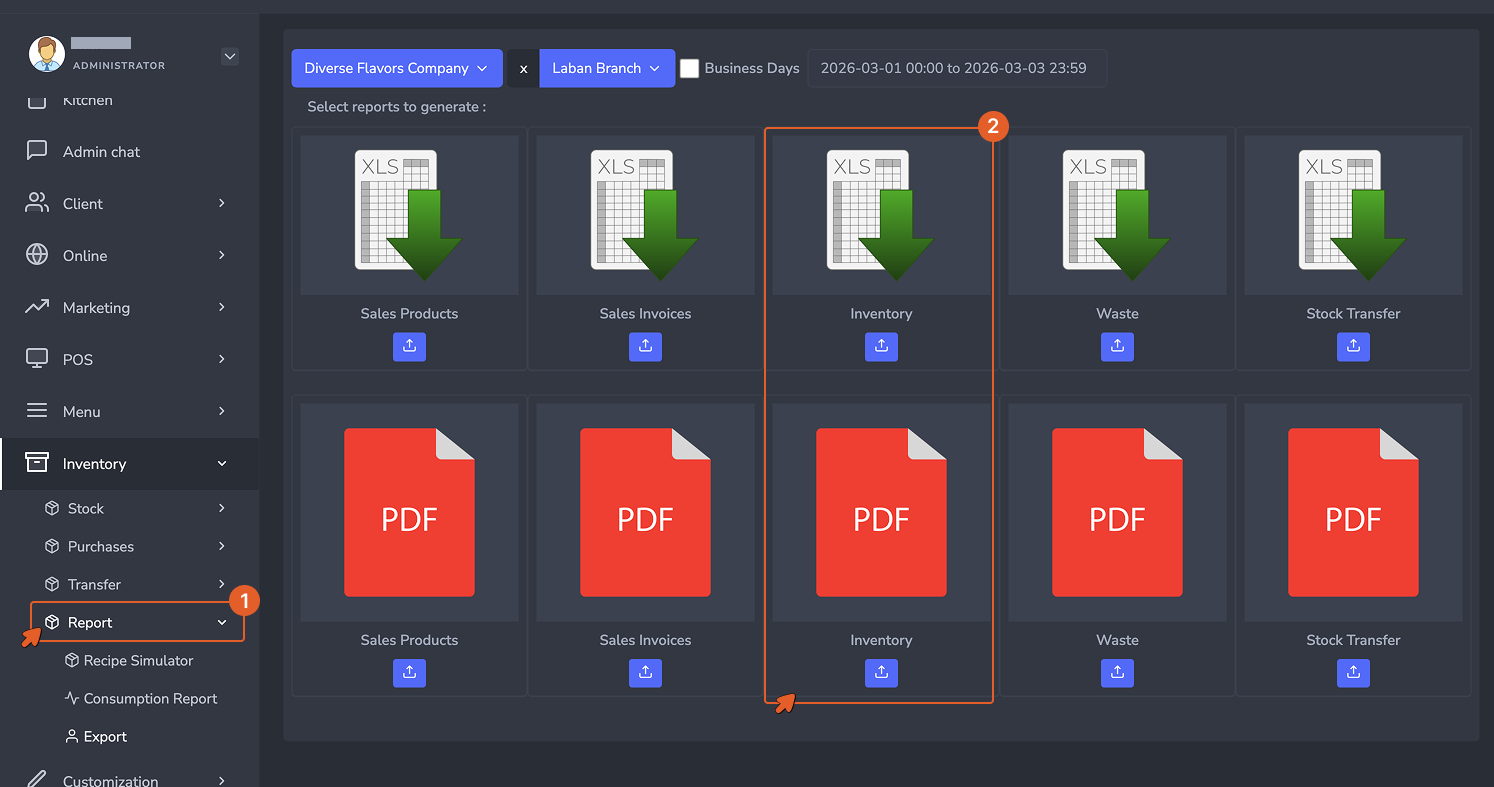
The Inventory Report is the most comprehensive report in your system. It gives you a full ingredient-level breakdown of everything that happened to your stock during a selected period — from opening balance through every movement all the way to the closing balance.

تقرير المخزون

تقرير المخزون هو التقرير الأكثر شمولاً في نظامك. يمنحك تفصيلاً كاملاً على مستوى المكونات لكل ما حدث لمخزونك خلال فترة مختارة — من الرصيد الافتتاحي عبر كل حركة وصولاً إلى الرصيد الختامي.

Navigate to Inventory → Report → Export → Inventory Report. Select your date range and branch, then export or view on screen.

انتقل إلى المخزون ← التقارير ← تصدير ← تقرير المخزون. حدد نطاق التاريخ والفرع، ثم صدِّر أو اعرض على الشاشة.

Inventory Report

The Inventory Report showing a full ingredient movement summary per branch, with theoretical vs. actual consumption comparison and cost variance.

تقرير المخزون يُظهر ملخصاً كاملاً لحركة المكونات لكل فرع، مع مقارنة الاستهلاك النظري بالفعلي وانحراف التكلفة.

Column Definitions

تعريفات الأعمدة

ColumnWhat it shows
BranchThe branch this row of data belongs to.
IngredientThe raw material being tracked.
PriceThe unit cost of the ingredient.
Opening BalanceThe quantity on hand at the start of the selected period.
PurchasedQuantity received through purchase orders during the period.
TransferredQuantity sent out to another branch.
ReceivedQuantity received from another branch via transfer.
WastedQuantity logged as waste during the period.
SalesQuantity theoretically consumed based on recipes x units sold.
PreparationQuantity consumed through preparation/production orders.
Theo. ConsumedTotal theoretical consumption (Sales + Preparation).
Actual ConsumedReal consumption measured via physical stock count.
Var. ConsumptionThe gap between theoretical and actual consumption. A negative value signals unexplained loss.
Ending BalanceQuantity remaining at the end of the period.
Theo. Consumption CostTotal cost of theoretically consumed stock.
Real. Consumption CostTotal cost of actually consumed stock.
Var. Cost %The percentage difference between theoretical and real consumption cost.
Inventory CostThe value of stock remaining at period end.
Waste CostThe total cost of wasted ingredients.
العمودما يُظهره
الفرعالفرع الذي تنتمي إليه هذه الصفحة من البيانات.
المكونالمادة الخام التي يتم تتبعها.
السعرتكلفة وحدة المكون.
الرصيد الافتتاحيالكمية الموجودة في بداية الفترة المختارة.
المشترياتالكمية المستلمة من خلال أوامر الشراء خلال الفترة.
المحوَّلالكمية المُرسَلة إلى فرع آخر.
المستلَمالكمية المستلمة من فرع آخر عبر التحويل.
الهدرالكمية المسجَّلة كهدر خلال الفترة.
المبيعاتالكمية النظرية المستهلكة بناءً على الوصفات × الوحدات المباعة.
التحضيرالكمية المستهلكة من خلال أوامر التحضير/الإنتاج.
الاستهلاك النظريإجمالي الاستهلاك النظري (المبيعات + التحضير).
الاستهلاك الفعليالاستهلاك الحقيقي المقاس عبر جرد المخزون الفعلي.
انحراف الاستهلاكالفجوة بين الاستهلاك النظري والفعلي. القيمة السالبة تُشير إلى خسارة غير مبررة.
الرصيد الختاميالكمية المتبقية في نهاية الفترة.
تكلفة الاستهلاك النظريإجمالي تكلفة المخزون المستهلك نظرياً.
تكلفة الاستهلاك الفعليإجمالي تكلفة المخزون المستهلك فعلياً.
انحراف التكلفة %الفرق المئوي بين تكلفة الاستهلاك النظري والفعلي.
تكلفة المخزونقيمة المخزون المتبقي في نهاية الفترة.
تكلفة الهدرإجمالي تكلفة المكونات المهدرة.
Key insight: رؤية أساسية: The Var. Consumption and Var. Cost % columns are your most important indicators. Any significant negative variance should trigger an immediate investigation — it typically points to over-portioning, unrecorded waste, theft, or missing recipes. عمودا انحراف الاستهلاك وانحراف التكلفة % هما أهم مؤشراتك. أي انحراف سلبي كبير يجب أن يُطلق تحقيقاً فورياً — فهو يشير عادةً إلى الإفراط في التقديم أو الهدر غير المسجَّل أو السرقة أو الوصفات المفقودة.

Sales Report

The Sales Report gives you a product-level breakdown of everything sold during a selected period. It is your primary tool for monitoring sales performance, identifying top-selling items, and cross-referencing revenue against food costs.

تقرير المبيعات

يمنحك تقرير المبيعات تفصيلاً على مستوى المنتج لكل ما تم بيعه خلال فترة مختارة. إنه أداتك الأساسية لمراقبة أداء المبيعات وتحديد الأصناف الأكثر مبيعاً ومطابقة الإيرادات مع تكاليف الغذاء.

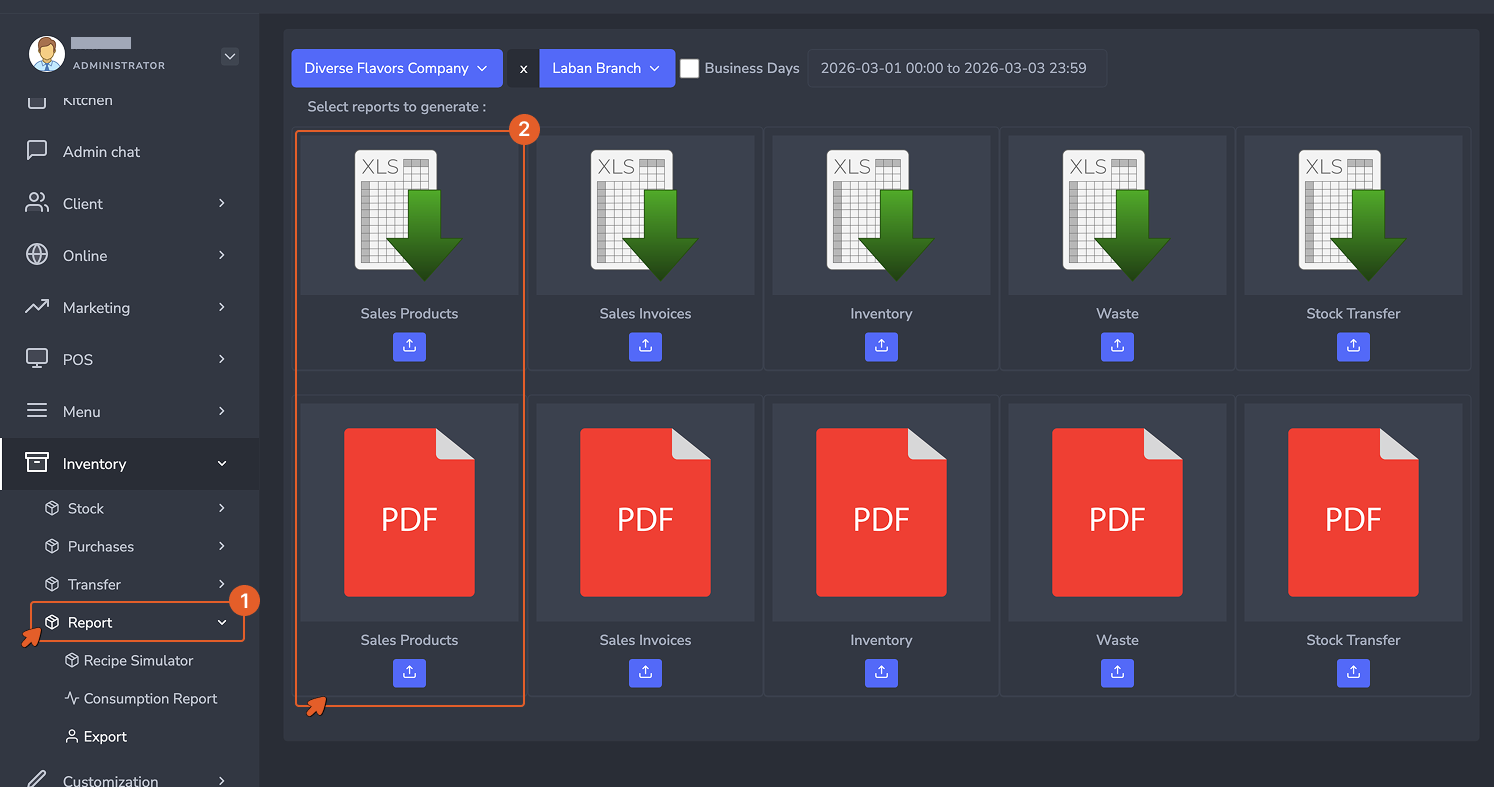
Navigate to Inventory → Report → Export → Sales Products. Select your date range and branch to generate the report.

انتقل إلى المخزون ← التقارير ← تصدير ← منتجات المبيعات. حدد نطاق التاريخ والفرع لإنشاء التقرير.

Sales Report

The Sales Report displaying product-level sales data per branch and device, including quantities sold and total revenue over the selected period.

تقرير المبيعات يعرض بيانات المبيعات على مستوى المنتج لكل فرع وجهاز، بما في ذلك الكميات المباعة وإجمالي الإيرادات خلال الفترة المختارة.

What the columns mean:

معنى الأعمدة:

  • Branch: The branch where the sale occurred.
  • Device Name: The POS terminal or device used to process the sale.
  • Product ID / Product Ref: The unique identifier and reference code of the sold product.
  • Product Name: The name of the product as configured in the menu.
  • Category: The menu category the product belongs to.
  • Selling Price: The price at which the product was sold.
  • Sales Qty: The total number of units sold during the period.
  • Sales Amount: The total revenue generated by this product (Selling Price x Sales Qty).
  • الفرع: الفرع الذي جرت فيه عملية البيع.
  • اسم الجهاز: نقطة البيع أو الجهاز المستخدم لمعالجة البيع.
  • معرِّف المنتج / مرجع المنتج: المعرِّف الفريد ورمز المرجع للمنتج المباع.
  • اسم المنتج: اسم المنتج كما هو مُهيَّأ في القائمة.
  • الفئة: فئة القائمة التي ينتمي إليها المنتج.
  • سعر البيع: السعر الذي تم بيع المنتج به.
  • كمية المبيعات: إجمالي عدد الوحدات المباعة خلال الفترة.
  • مبلغ المبيعات: إجمالي الإيرادات التي حققها هذا المنتج (سعر البيع × كمية المبيعات).
Cross-reference this report with the Inventory Report to validate that theoretical consumption aligns with your sales volume. A spike in sales with no matching increase in ingredient consumption is a red flag for recipe misconfiguration. قارن هذا التقرير بتقرير المخزون للتحقق من أن الاستهلاك النظري يتوافق مع حجم مبيعاتك. ارتفاع مفاجئ في المبيعات دون زيادة مقابلة في استهلاك المكونات يُعدّ مؤشراً تحذيرياً على وجود خطأ في تهيئة الوصفة.

Waste Report

The Waste Report tracks every ingredient or item that was manually logged as wasted during a selected period. This report helps you measure the true direct cost of waste and hold branches and employees accountable.

تقرير الهدر

يتتبع تقرير الهدر كل مكون أو صنف تم تسجيله يدوياً كهدر خلال فترة مختارة. يساعدك هذا التقرير على قياس التكلفة المباشرة الحقيقية للهدر ومحاسبة الفروع والموظفين.

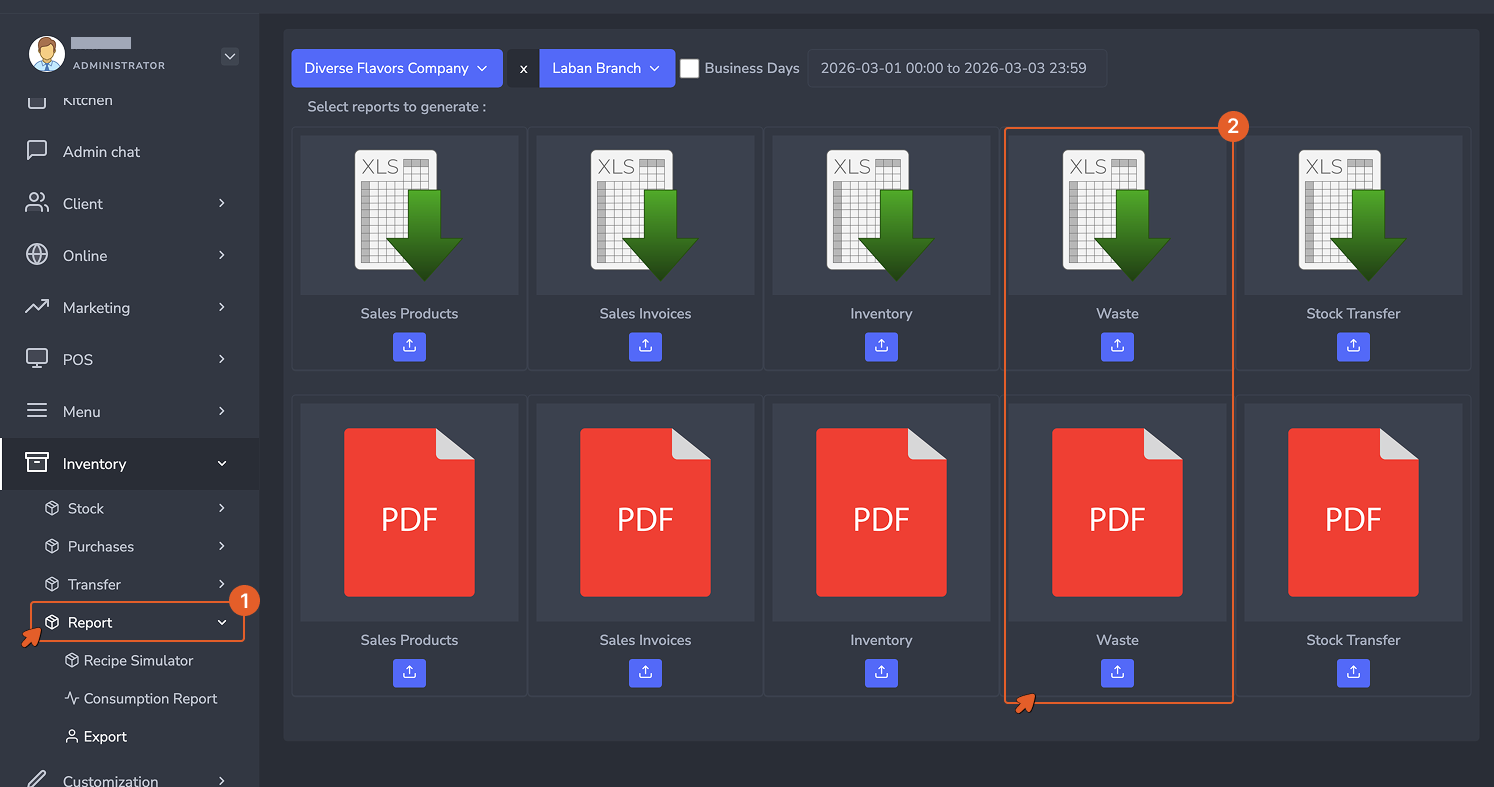
Navigate to Inventory → Report → Export → Waste Report. Select your date range and branch to generate the report.

انتقل إلى المخزون ← التقارير ← تصدير ← تقرير الهدر. حدد نطاق التاريخ والفرع لإنشاء التقرير.

Waste Report

The Waste Report listing each waste entry by branch, employee, date, item, quantity, and cost.

تقرير الهدر يُدرج كل إدخال هدر حسب الفرع والموظف والتاريخ والصنف والكمية والتكلفة.

What the columns mean:

معنى الأعمدة:

  • Branch Ref / Branch Name: The branch where waste was recorded.
  • Employee Name: The staff member who logged the waste entry.
  • Date + Time: Exact timestamp of when the waste was recorded.
  • Type: Whether the wasted item is an ingredient or a finished product.
  • Item ID / Item Name / Item Ref: The specific ingredient or product wasted.
  • Qty: The quantity wasted.
  • MU: The unit of measure.
  • Cost by Unit: The unit cost of the wasted item.
  • Total Cost: The total value lost due to this waste entry.
  • مرجع الفرع / اسم الفرع: الفرع الذي سُجِّل فيه الهدر.
  • اسم الموظف: الموظف الذي سجَّل إدخال الهدر.
  • التاريخ + الوقت: الطابع الزمني الدقيق لوقت تسجيل الهدر.
  • النوع: ما إذا كان الصنف المهدر مكوِّناً أم منتجاً نهائياً.
  • معرِّف الصنف / اسم الصنف / مرجع الصنف: المكون أو المنتج المحدد الذي أُهدر.
  • الكمية: الكمية المهدرة.
  • وحدة القياس: وحدة القياس المستخدمة.
  • التكلفة بالوحدة: تكلفة الوحدة للصنف المهدر.
  • التكلفة الإجمالية: إجمالي القيمة المفقودة بسبب هذا الإدخال.
Important: مهم: Waste must be actively logged by staff for this report to be meaningful. Unlogged waste will appear as unexplained variance in the Inventory Report instead — making it harder to trace the root cause. يجب على الموظفين تسجيل الهدر بفاعلية حتى يكون هذا التقرير ذا معنى. الهدر غير المسجَّل سيظهر كانحراف غير مبرر في تقرير المخزون بدلاً من ذلك — مما يُصعِّب تتبع السبب الجذري.

Stock Transfer Report

The Stock Transfer Report tracks every movement of stock between branches — recording both the sending side and the receiving side, along with the quantities transferred vs. actually received.

تقرير تحويل المخزون

يتتبع تقرير تحويل المخزون كل حركة مخزون بين الفروع — مسجِّلاً جانب الإرسال وجانب الاستلام، إلى جانب الكميات المحوَّلة مقابل المستلمة فعلياً.

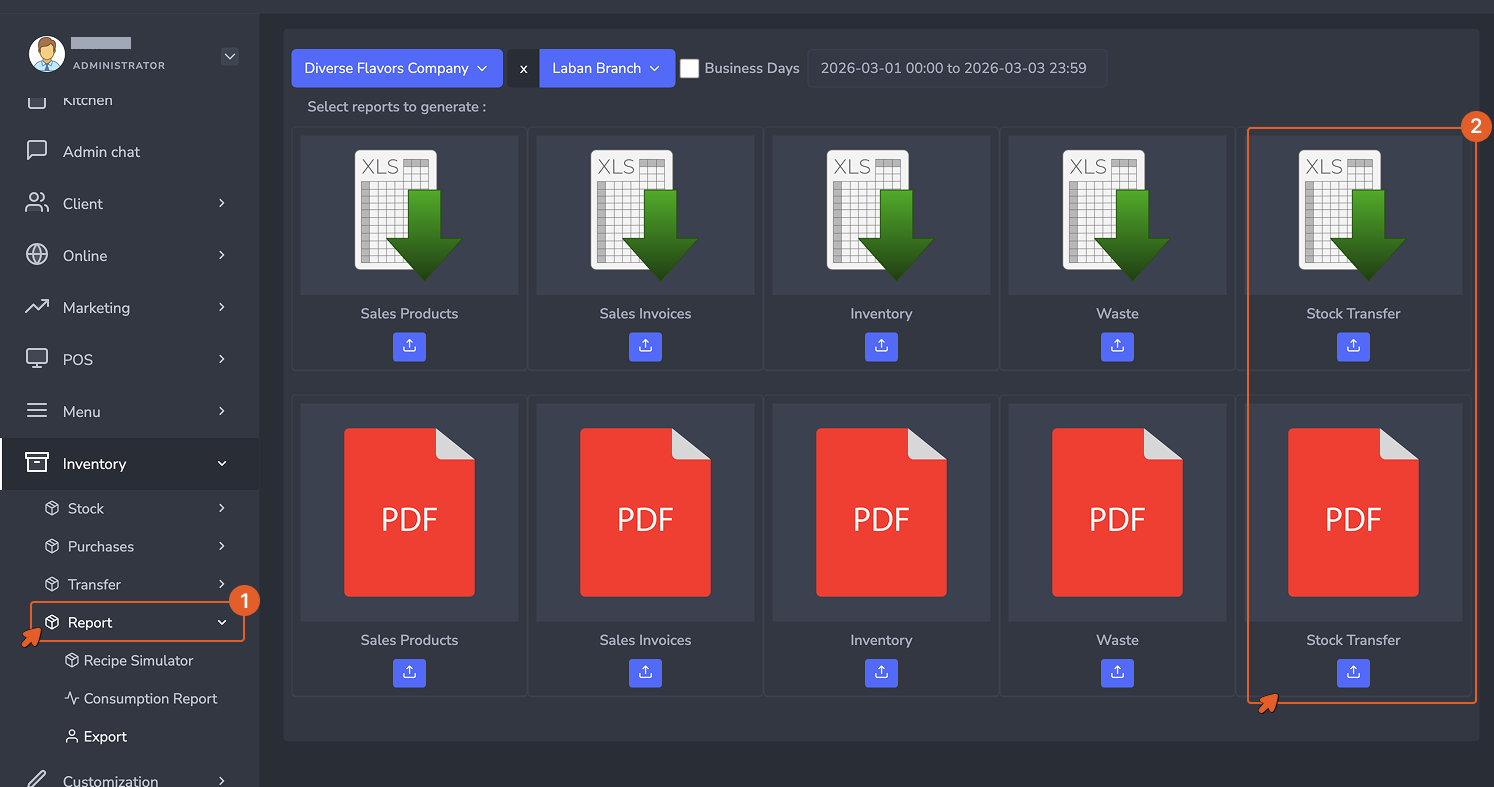
Navigate to Inventory → Report → Stock Transfer Report. Select your date range to view all inter-branch transfers during that period.

انتقل إلى المخزون ← التقارير ← تقرير تحويل المخزون. حدد نطاق التاريخ لعرض جميع التحويلات بين الفروع خلال تلك الفترة.

Stock Transfer Report

The Stock Transfer Report showing full transfer records between branches, including transfer and reception quantities and the employees involved on each side.

تقرير تحويل المخزون يُظهر سجلات التحويل الكاملة بين الفروع، بما في ذلك كميات التحويل والاستلام والموظفون المعنيون في كل جانب.

What the columns mean:

معنى الأعمدة:

  • Source Ref / Source Name: The branch that sent the stock.
  • Transfer Employee: The staff member who initiated and dispatched the transfer.
  • Transfer Date: The date the stock left the source branch.
  • Destination Ref / Destination Name: The branch that received the stock.
  • Reception Employee: The staff member who confirmed receipt at the destination.
  • Reception Date: The date the stock was received and logged at the destination.
  • Type: Whether the transferred item is an ingredient or a finished product.
  • Item ID / Item Name / Item Ref: The specific item transferred.
  • Transfer Qty: The quantity dispatched from the source branch.
  • Reception Qty: The quantity confirmed received at the destination.
  • MU: Unit of measure.
  • Cost by Unit: Unit cost of the item at time of transfer.
  • Total Cost: Total value of the transfer.
  • مرجع المصدر / اسم المصدر: الفرع الذي أرسل المخزون.
  • موظف التحويل: الموظف الذي بدأ التحويل وأرسله.
  • تاريخ التحويل: التاريخ الذي غادر فيه المخزون الفرع المصدر.
  • مرجع الوجهة / اسم الوجهة: الفرع الذي استلم المخزون.
  • موظف الاستلام: الموظف الذي أكَّد الاستلام في الوجهة.
  • تاريخ الاستلام: التاريخ الذي تم فيه استلام المخزون وتسجيله في الوجهة.
  • النوع: ما إذا كان الصنف المحوَّل مكوِّناً أم منتجاً نهائياً.
  • معرِّف الصنف / اسم الصنف / مرجع الصنف: الصنف المحدد الذي تم تحويله.
  • كمية التحويل: الكمية المُرسَلة من الفرع المصدر.
  • كمية الاستلام: الكمية المؤكَّدة في الوجهة.
  • وحدة القياس: وحدة القياس المستخدمة.
  • التكلفة بالوحدة: تكلفة الوحدة للصنف وقت التحويل.
  • التكلفة الإجمالية: إجمالي قيمة التحويل.
Always compare Transfer Qty vs. Reception Qty. Any gap means stock was lost, damaged, or unrecorded in transit. Consistent discrepancies on the same route should trigger a process review. قارن دائماً كمية التحويل بكمية الاستلام. أي فجوة تعني أن المخزون قد فُقِد أو تلِف أو لم يُسجَّل أثناء النقل. التناقضات المتكررة على نفس المسار يجب أن تُطلق مراجعة للعملية.